
Erin Sykes
2024 Market Outlook
New Year 2024
We have turned a page to 2024, and with it, a corner in the real estate market.
In the United States, the 2023 market was stagnant, frozen, and confused. It wasn’t great for buyers, sellers, or agents. But thankfully, the worst is behind us and the future looks bright.
The most recent data shows that the lock-in-effect, whereby homeowners are hesitant to sell homes tied to ultra-low rates, has likely peaked, indicating that new inventory has begun to filter into the market, balancing supply & demand and thus increasing interest, affordability, and competition. Although purchase applications remain about 17% lower than a year ago, we can look forward to increased transaction volume in the coming months.
As new listing options increase (in fact, November showed a gain of 5% y/y according to realtor.com), and rates decrease (the 30-year is down well over a full point from the Fall highs), existing home sales are expected to climb. As agents, we have been busy with showings, but offers have been slow to manifest. Throughout 2023, buyers were faced with the continuous headwinds of sustained prices, high rates, and minimal selection. With at least two of those challenges softening, the power dynamic between buyer and seller has reset and the opportunity for deal-making abounds.
Due to the low resale inventory available through 2023, new construction increased to approximately 1/3 of total single-family inventory, when historically it only accounted for 10%-15% of available homes. We expect new construction to continue to show favor, but not in the extremes experienced over the past year.
Irrational exuberance is also thankfully behind us, as home price growth has stabilized, currently sitting at 4.8%; close to the 4.4% y/y average.
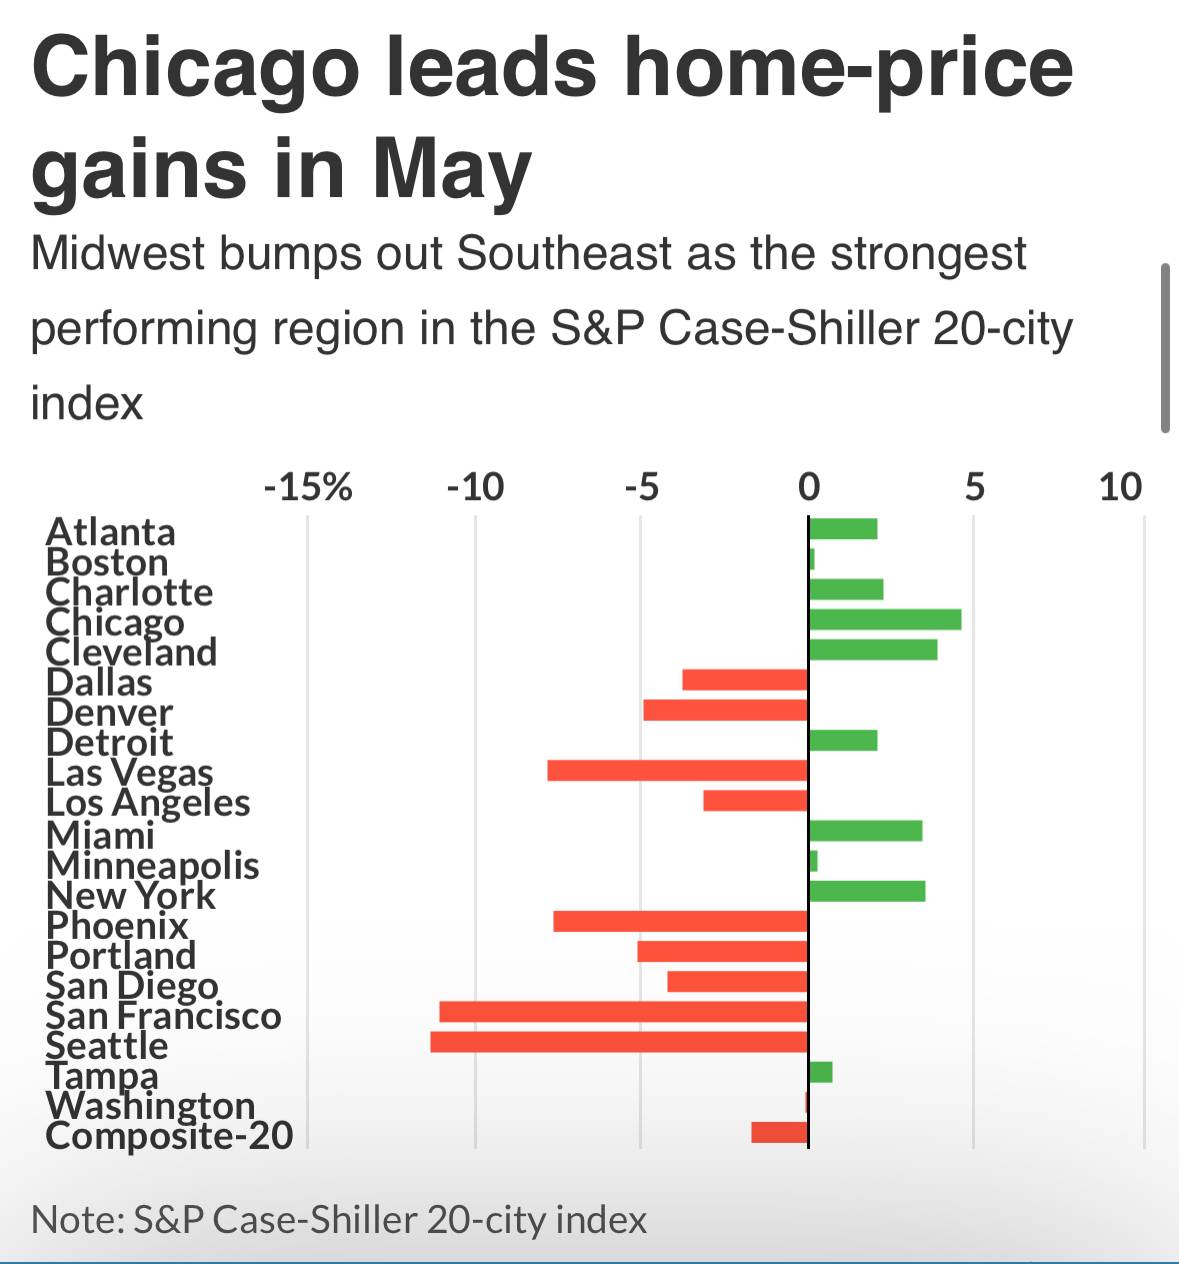
We must reiterate that real estate is local, and shifts in home prices vary greatly pending geography, as shown by the chart below. The Southwest and Western US has seen the greatest pullback in prices; which have reached -10% y/y in some cities, whereas the historically more affordable Northeast and Midwest have seen the most price appreciation as many searched for a lower cost of living to combat inflation. We expect to see seasonality become more influential, however, as the Southeast welcomes snowbirds from colder climates who have been renting for prior seasons, waiting for the ‘right time’ to buy.
EXPANDING ALWAYS, IN ALL WAYS
2023 was time for aggressive deal makers to take advantage of fear in the market and scoop deals. Early 2024 will present an opportunity for savvy buyers to take advantage of low hanging fruit before transaction volume picks up following expected Fed rate cuts. Mid-2024 will bring the stability needed for the vast majority of buyers to make offers.
True to our mantra of expanding always, in all ways, we are grateful to have welcomed 18 new offices to the Nest Seekers family in 2023, from Ontario to Tel Aviv, Milan to Southeast Asia. Crazy Rich Agents debuted to rave reviews on the BBC. And our New Development teams have represented some of the most successful and prestigious buildings in New York City, Miami, and Los Angeles. We are thrilled with our continued forward progress and expect the momentum to continue in 2024.
GLOBAL PREDICTIONS
· A.I. disruption will focus on buyer-product alignment
· Loan rates will decrease but stay north of 5.5% for the 30-year fixed
· Price growth will stabilize at historic average levels (4.4%)
· Transaction volume will increase y/y
· Office-to-residential conversions will be center stage for urban developers
· Many of the 2,000,000 licensed real estate agents will fail to renew their licenses due to changing industry dynamics. The remaining agents will represent the strongest of their peers.
· International deals will disrupt more traditional, local deal flow
Case Shiller v. Luxury
You may be seeing headlines like: “U.S. home prices rose for the fourth straight month in May,” but once you open the click-bait, further details show that year/year prices have actually fallen 1.7% per the 20-city Case Shiller index.
And, even after reading the fine print, it’s likely that you’re still not getting the full story.
Case Shiller only accounts for 20 cities across the country; thus, it may be irrelevant to your market (actually, it’s highly likely that the index will not reflect your home market at all).
Additionally, Case Shiller does not tell an accurate story about the luxury segment. It’s a broad-brush average of national price movement, but what we are seeing is continued bifurcation between the luxury and mass markets.
We started seeing price reductions in the luxury segment months ago, with current closing prices averaging 15% below list in the Palm Beach and Miami Beach markets.
Now why would luxury be hit harder that the mass market? Isn’t luxury ‘immune’ to downturns and mortgage rate fluctuations?
While it is true that higher price points generally reflect more unique properties and thus offer more general resilience, the word ‘luxury’ is grossly overused in the real estate industry, as are the words ‘exclusive’ ‘rare’ and ‘extraordinary.’ The abundance of properties marketed as ‘luxury’ has watered down the term’s meaning and thus confused the conversation regarding segment resilience.
Further proving that no one is immune, the enclave of Palm Beach Island, with a median sales price of over $14,000,0000, saw a 519% y/y increase in inventory for single family homes in June 2023. Across the bridge in West Palm, the 2 mile stretch South of Southern/East of US 1 called ‘SoSo’ has 73 active single family listings ranging from $559,000 to $22,300,000.
Inventory is not the problem anymore. The issue is fear. Fear of overpaying. Fear of the future. Fear of recession. Fear of interest rates. Fear of sustained inflation.
Ironically, inaction breeds more fear and eventually, a self-fulfilling prophecy emerges… unless you change the narrative.
Instead of sitting on the sidelines, take the opportunity to capitalize on pessimism and capitalize on potential for long-term growth, ignoring the bumps in the road.
"The crowd is usually wrong on the market."
-Stanley Druckenmiller
Real Estate Reality Check

Ivory tower syndrome is alive and well. Zillow predicts home prices to increase 4.8% over the next year 🤔
Reminder that Zillow had to shutter their iBuying business because their pricing algorithm was so off. Also, the Zillow CEO sold his house for 40% less than its Zestimate in 2016.
Don’t just look at the data, look as who is creating the metrics. There are plenty of individuals and entities that will feign extraordinary circumstances in order to validate a high list price… not to mention there is a 1-3 month lag in national data compared to what we see in real time as boots-on-the-ground agents.
Even more importantly, there is a difference in demand vs. DESIRE.
Sure a lot of people desire to purchase a home in a specific market, but are their circumstances realistic?
Actual demand is driven by realistic desire.
There’s a lot more to unpack here, but long/short
•Mortgage rates aren’t going down any time soon.
•Developers are not altruistic; they need to foresee ROI to start a project. Until that margin exists, single family starts will be quiet.
•Buyers need to be motivated to write a contract.
•Buyers, take advantage of fear in the market and negotiate. The ball is finally in your court.
•Don’t get stuck in a perpetual renting cycle. Rent at the bottom of your budget.
•Focus long term.
2022 Market Recap and 2023 Predictions
Economists are often asked to oversimplify a topic or position in the market at a specific moment in time. We experience this when writing reports and being interviewed for television segments, but the reality is that it’s impossible to summarize an incredibly complex situation in just a few sentences. Real estate is diversified on a micro level; from varying geographies to price points, use cases, etc. There are consequences to action, and its often the second and third order events that are the most impactful, as they are missed in the vast number of predictions. COVID lockdowns and the subsequent housing boom is a prime example.
Our goal in this end-of-year newsletter is to clarify the chatter from the reality and provide insight from macro and micro metrics plus boots-on-the-ground agents who live and breathe their markets every day.
PRICES
After a strong first half of the year, we felt a slowing in early fall, when the NYSE reached a 2022 low and the average 30-year mortgage rate rose from 3.16% to 7.2% in 10 months, effectively increasing the median homeowner monthly payment by more than 55%. People started acting from a place of fear due to economic uncertainty, inflation, stock market volatility, negative click bait, and later, a crypto bust. And scared people do irrational, often desperate, things.
The irony is that by the time main street starts talking about inflation, recession, etc., we are likely already in the thick of it, or even through the other side. We believe that housing costs, including rental prices, are on the path to stabilizing.
Of the 51 regional housing markets tracked by Black Knight, all 51 have seen prices fall from 2022 peak, creating opportunity for those who stayed ready to purchase.
MORTGAGE RATES
The average 30-year mortgage has been hovering around 7% for the last quarter of 2022, still below the 50-year average of 7.77%. As a nation, we are recovering from recency bias related to the last decade of ultra-low rates, but more moderate rates are likely here to stay for awhile.
https://www.mortgagenewsdaily.com/mortgage-rates/30-year-fixed
Inputs into individual mortgage rates go well beyond the Fed Funds Rate, and include metrics on inflation, unemployment and jobless claims, credit scores, down payments, and demand for mortgages. With demand for new mortgages down over 40% from last year, reaching the lowest level since 1997, and refinance demand down 87% from last year, lenders are looking to buy downs and sweeteners to spark interest in the slower market. This is the opportunity many side-lined buyers had been hoping for.
As of mid-December, inflation is still running at a 7.1% annual rate, well beyond the 2% goal, but the end-of-year rally served as a bright spot none-the-less, reassuring weary investors that they worst may indeed be behind us.
Moving forward, we expect see a more cautious and less aggressive Fed, focused on easing extreme volatility, giving Americans time to catch their breath and monetary policy makers time to see the ongoing, rolling effects of previous decisions. It is clear that we should not interpret a slower pace of rate hikes and moderating inflation as an easing, but more of a plateau and holding pattern to curtail the stickier, long-term effects of inflation.
MARKETS
NYC
New York City is a place know for extremes, and 2022 has been no exception. Return-to-office saw many migrate back to the city, even if on a part time basis. Those who missed the vibrant lifestyle of Manhattan have begun to even keel in a lifestyle split between The Hamptons, Florida, and their urban abodes.
John Carbone, Managing Director, Nest Seekers Park Avenue, explains: “Market activity is more or less what we historically saw pre-pandemic across all boroughs and all asset classes. The most interesting aspect of this year was the ultra-high end of the market continuing its pull away from the realities faced by the sub-$50MM market. In 2022 we saw a proliferation of eight- and nine-figure properties come to market and sell across new developments and established buildings alike. I suspect that the economics of the very top of the market will set the stage for many more blockbuster transactions in the coming year. Like exceptional art, there will always be a market for exceptional properties.”
Manhattan
Average Listed Price: + 3.3% in November y/y
Average Sold Price: + 7.1% in November y/y
Average Days on Market: - 6.9% in November y/y
Total Transactions: - 59.6% in November y/y
Brooklyn
Average Listed Price: - 20.9% in November y/y
Average Sold Price: + 5.6% in November y/y
Average Days on Market: + 12.8% in November y/y
Total Transactions: -.4% in November y/y
Queens
Average Listed Price: - 2.4% in November y/y
Average Sold Price: -.6% in November y/y
Average Days on Market: - 22% in November y/y
Total Transactions: - 33% in November y/y
GREENWICH
Greenwich is a town of 65,000 +/- people spanning ~60 square miles, and combines New England countryside living with small, but bustling, villages/town centers. Transaction volume in the market has been more resilient that in other areas of the country, showing a more or less flat number of total active sales and minimal movement in days on market.
Vincent Zappier, Operations Manager in Nest Seekers’ Greenwich office explains: “Greenwich remains a desirable and convenient respite to city life, with incredible schools and the lifestyle desires for families and individuals.”
Greenwich, Riverside, Old Greenwich, Cos Cob
Single Family Average Listed Price: - 11.53% in November y/y
Single Family Average Sold Price: - 12.49% in November y/y
Single Family Total Active Sales: Flat in November y/y
Single Family Average Days on Market: - 2.31% in November y/y
COLORADO
Mountain luxury is no longer defined as strictly being on the ski hill; there is strong desire for summer activities like golf, mountain biking, fly fishing, sailing and hiking, and local festivals, thus continuing to attract many new residents to the towns of Aspen, Vail and Breckenridge.
Nest Seekers Agent Kyle Coy explains: “Colorado resort destinations saw list prices increase almost 20% y/y and sold prices increase 15% on average. Inventory is holding relatively flat though the number of transactions is down significantly.”
Aspen Single Family & Condos
Average Listed Price: - 2.97% in November y/y
Average Sold Price: + 18.6% in November y/y
Total Sold Listings: - 47.4% in November y/y
Average Days on Market: - 2.78% in November y/y
Vails Single Family & Condos
Average Listed Price: - 14.32% in November y/y
Average Sold Price: + 4.16% in November y/y
Total Sold Listings: - 47.9% in November y/y
Average Days on Market: - 7.49% in November y/y
Breckenridge Single Family
Average Listed Price: + 3.3% in November y/y
Average Sold Price: - 3.5% in November y/y
Total Active Sales: - 48.1% in November y/y
Average Days on Market: + 103% in November y/y
BEVERLY HILLS
While 2022 has seen overall slowing in many parts the country as a result of repeated interest rate hikes, Beverly Hills has remained one of the strongest and steadiest real estate markets nationwide, with median home prices remaining in the $5M range, up 21% y/y from November 2021.
Top Nest Seekers Beverly Hills agent Alyssa Azzara explains: “While still a Seller’s markets, excessive bidding wars and multiple offers have curtailed from peak 2021. Buyers have benefitted from slight boosts in inventory between October 2022 and November 2022 with minimal pricing fluctuation. Hot properties can be expected to sell slightly above or at ask within 30-40 days on market while average-demand sales are trading slightly below ask and within 60-90 days on average.”
Beverly Hills
Single Family Average Sold Price: + 1.1% in November y/y
Single Family Total Active Sales: + 1.2% in November y/y
Single Family Average Days on Market: + 1.1% in November y/y
Single Family Total Transactions: - 1.2% in November y/y
HAMPTONS
The Hamptons continues to be one of the most affluent communities in the country but is not totally immune to changing market dynamics, with 11 of the 12 local regions showing a slowdown in transaction volume.
Jimmy Guiliano, Nest Seekers’ top Hamptons agent says, “Things are definitely slowing down and pulling back slightly… but with the ultra-low inventory prices have not decreased more than 10%. I expect further slowing, because we are struggling with a disparity in mindset; Sellers think it’s still 2021 and Buyers think it's already 2023 which essentially freezes the market.”
Hamptons:
Single Family Median Listed Price: + 18.9% in November y/y
Single Family Median Sold Price: + 5.26% in November y/y
Single Family Average Days on Market: + 14% in November y/y
Sale-to-List Price: 96.6% in November 2022
NEW JERSEY
Adding to our established offices in Jersey City/Hoboken and Summit, Nest Seekers welcomed our new Rumson-based Jersey Shore office in 2022, capitalizing on the strong demand for beach homes on the state’s barrier islands as an alternative to the Hamptons.
Hoboken/Downtown Jersey City
Average Listed Price: + 21.1% in November y/y
Average Sold Price: + 21.3% in November y/y
Average Days on Market: - 12.2 in November y/y
Total Transactions: - 42.3% in November y/y
Summit
Average Listed Price: - 1.3% in November y/y
Average Sold Price: + 2.2% in November y/y
Average Days on Market: + 11.1% in November y/y
Total Transactions: - 18.2% in November y/y
Jersey Shore
Average Listed Price: + 12.7% in November y/y
Average Sold Price: + 15.3% in November y/y
Average Days on Market: - 11.1% in November y/y
Total Transactions: - 29.6% in November y/y
FLORIDA
South Florida continues to make headlines as Wall Street south, with Goldman Sachs, Citadel, and others shifting their work forces to West Palm Beach and Miami. That said, it’s important to differentiate regions as we are seeing individual microtrends play out in each.
Palm Beach is deep pocketed wealth, with over 80% of transactions happening in cash. Prior to 2020, the large island estates rarely changed hands and stayed generationally within the same families. The slowing in transaction volume of the Palm Beach market is evident, while prices remain stable, after accounting for outlier transactions of $100 million+.
Palm Beach Island
Single Family Median Sold Price: - 30% in November y/y
Condo Median Sold Price: - 13% in November y/y
Single Family Total Sales Volume: - 8.4% in November y/y
Condo Total Sales Volume: - 90% in November y/y
Single Family Average Days on Market: + 240% in November y/y
Condo Average Days on Market: + 76% in November y/y
Miami is tied more closely to the socio-economics and politics of Latin America than the US. We are seeing a surge in demand from Colombian and Brazilian investors after their recent Presidential elections. New construction is at the heart of the Miami luxury market, whereby international investors lock in a price today for delivery in 4-5 years with staged payments throughout that period. This moves money from, often unstable, home countries into US tangible assets.
Miami Beach:
Single Family Average Sold Price: + 11.48% in November y/y
Condo Average Sold Price: + 8.95% in November y/y
Single Family Total Sales Volume: - 70% in November y/y
Condo Total Sales Volume: - 44.72% in November y/y
Single Family Average Days on Market: - 8.16% in November y/y
Condo Average Days on Market: - 32.43% in November y/y
EUROPE & THE UK
London remains the most expensive of any region in the UK, but it also continues to be the region with the lowest annual growth. In comparison, Portugal’s growth remains strong, with Golden Visa opportunities supporting investment in the country.
Portugal:
Lisbon Average Sold Price: + 3.1% in November y/y
Porto Average Sold Price: + 6% in November y/y
Algarve Average Sold Price: + 17.5% in November y/y
Cascais Average Sold Price: +13.7% in November y/y
Expanding Always, In All Ways
In 2023, rates will remain elevated, inflation sticky, and transactions will slow. It will be an opportune time for savvy buyers to capitalize and reminder that if you’re scared, you miss opportunities. The crypto fall out is not expected to hit real estate directly, though there may be some isolated incidences that are sure to make headlines.
At Nest Seekers, we are focusing on the solutions, not the problems.
We will welcome yet another new office to the Nest Seekers family, with the recent launch of Mexico with over $500 million in new listings.
And true to form in expanding always, in all ways, we are thrilled for the launch of Selling the Hamptons on HBO Max and Crazy Rich Agents on the BBC.
See you in 2023!
Current State of the Real Estate Market

The average 30 year mortgage rate dropped 60 basis points briefly last week (from 7.22% to 6.62%) on news that inflation rose less than expected in October (with CPI increasing 0.4% instead of the 0.6% estimate). Inflation is still running at a 7.77% annual rate, well beyond the 2% goal, but the rally served as a bright spot none-the-less, reassuring weary investors that they worst may indeed be behind us.
Inputs into individual mortgage rates go well beyond the Fed Funds Rate, and include metrics on inflation, unemployment and jobless claims, credit scores, down payments, and demand for mortgages. With demand for new mortgages down over 40% from last year, reaching the lowest level since 1997, and refinance demand down 87% from last year, lenders are looking to buy downs and sweeteners to spark interest in the slower market. This is the opportunity many side-lined buyers had been hoping for.
Moving forward, we expect see a more cautious and less aggressive Fed focused on easing extreme volatility. After four consecutive 75 basis point hikes, it is likely we will see a moderated 50 basis point increase in December, giving Americans time to catch their breadth and monetary policy makers time to see the ongoing, rolling effects of previous decisions. It is clear that we should not interpret a slower pace of rate hikes and moderating inflation as an easing, but more of a plateau and holding patterns to curtail the stickier, long term effects of inflation.
It is very possible that we have been in the actual depths of recession for months, with a stock market bottom already fixed, and Q4 2022/Q1 2023 challenges already priced in. With this comes the nearing light at the end of the tunnel, though we can expect it to take time to unwind and rebalance excess money supply.
Current Listings (FL/NY/NJ):
•2317 Palm Harbor Drive, Palm Beach Gardens FL
$7,990,000
•3780 Lambert Avenue, West Palm Beach FL $1,200,000
•248 Cortez Road, West Palm Beach FL
$12,500/month
•Waldorf Astoria Residences, #8001, Miami FL $9,200,000
•48 Forest Road, Sag Harbor NY
$200,000+ (Summer Rental)
•18 Clay Court, Rumson NJ
$17,500,000
•163 E. 64th Street, NYC
$19,500,000
@nestseekers
Tune Out the Noise
The biggest challenge is to tune out the noise.
Because of the constant chatter regarding rising rates, many potential buyers are {irrationally} scared of entering the market. I have seen people become so paralyzed that they won’t even contact a lender to get a preliminary read on a mortgage preapproval. Its mind boggling to me how they are deciding an outcome before even doing their own research.
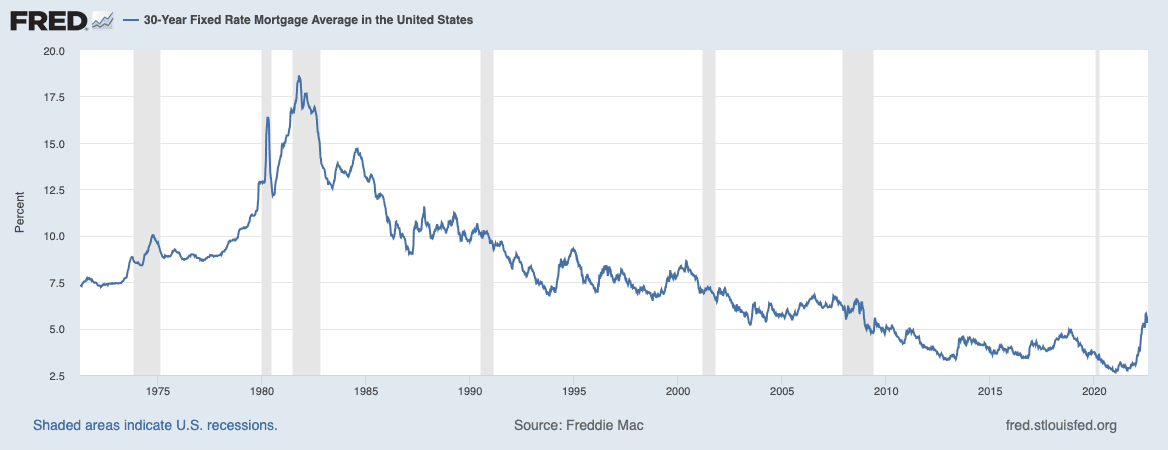
It’s true that mortgage rates have increased the monthly payment on a median home by more than 55% in 2022, but that’s because the Y/Y comparison is to 2021, which saw once-in-a-lifetime low rates. Freddie Mac started tracking the national average 30 year fixed rate in 1971 (swipe right) and since then we have seen rates as high as 18.27% and a historical average rate of 7.77%. Today, the national average is 5.13%.
There are so many additional inputs into an individual mortgage beyond the Fed Funds rate. Inflation, unemployment and jobless claims, location, individual credit score, and down payment all factor in to what your personal rate will be. I have clients who were approved for 4% and 4.5% 30 year rates this week, far below national averages.
So tune out the noise, do your own research, and get comfortable with making contrarian moves, because as Charlie Munger put it, “mimicking the heard invites regression to the mean.”
For more of my thoughts, check out this article in The Real Deal.
Miami Luxury Branded Developments
Waldorf Astoria, Aston Martin, Cipriani, The Standard, St. Regis, Baccarat, Casa Bella by B&B Italia, Bentley, E11EVEN, Diesel… names that ring as more than just luxury automotive, fashion, and restaurant brands, but also the newest batch of Miami condo developments.
It is estimated that there are already some 130 companies pursuing branded condo investments or licensing deal, with at least another 40 entering the category within the next few years. And as developers continue to forge ahead in an attempt to meet demand and make up the over 3 million housing unit shortage in the United States. We are seeing a flight to quality and futureproofed investment opportunities in buildings that will stand the test of time by offering a product that will be attractive to increasingly selective occupiers.
The most obvious benefit to these branded developments is that they speak to individual buyer personalities and allow pre-construction investors to feel confident in the final presentation of their chosen building. These buildings combine high fashion with five-star services and amenities, allowing homeowners to be immersed in luxury and convenience. It’s not just about a condo; it’s about a whole experience.
The caveat of branded residences is that structure is often one of licensing (but not always), which lends to the concept of ‘trusting the brand’ without fully doing your homework. The brands are often in charge of the condo’s creative direction, which means iconic elements or designs of the brand will be present, however, the quality of an ultra-luxury car does not necessarily transition into the quality of a condo project. This is where the buyer’s agents earn their stripes. Knowing which projects are fully managed vs. licensed and which developers consistently deliver a quality product in a timely manner.
Following are a selection of new developments that we believe have staying-power and provide value-add offerings for buyers.
Waldorf Astoria – Sky Collection (Cube 8)
Location: Downtown Miami
Developer: PMG
Estimated Completion: 2025
Starting Price Point: $3.5M
https://www.nestseekers.com/2129029/waldorf-astoria-residences-miami-4-br-condo-brickell-miami-fl
Much like the thriving Metropolis within which it sits, Waldorf Astoria Residences Miami offers an experience in transcendence - an exclusive lifestyle offering embedded within a legacy brand that has stood the test of time.
Residents here will not only assume a coveted place in a landmark building's history, but also as a part of a cutting-edge community of culture shapers, intrinsically playing a role in boldly defining social moments.
Waldorf Astoria Residences Miami, with its limitless views, extraordinary architecture and limitless brand, will usher in a new era for generations to come.
Set to become Miami’s tallest tower at 1,049 feet above the ground, Waldorf Astoria Residences Miami is an ultra-luxury development coming to Biscayne Boulevard, just minutes away from the new Miami World Center. This spectacular 100-story high-rise, developed by PMG (Property Markets Group) and Greybrook Realty Partners, will cover 800,000 square foot of land overlooking Biscayne Bay, Brickell Avenue, Downtown Miami, Key Biscayne, and South Beach. This magnificent building will enhance the Miami skyline with a unique futuristic design by acclaimed Carlos Ott and Sieger Suarez. The spectacular amenities at Waldorf Astoria Residences will set the bar high and will redefine the meaning of a luxury condo project in Miami.
The exclusive residences will include some spectacular features like private and semiprivate elevators, unobstructed views, summer kitchen balconies, 10’ to 12’ floor to ceiling windows, kitchen cabinets by Waldorf Astoria and much more.
Waldorf Astoria Residences Miami could not have chosen a better location, right in Downtown Miami. Set around the Central Business District, this location offers the bests stores, restaurants, cultural spots, and nightlife.
Baccarat Hotel and Residences
Location: Brickell
Developer: Related Group
Estimated Completion: 2025
Starting Price Point: $1.4M
Baccarat proudly presents its first collection of residences to the Miami market. Illuminated by the infinite shimmer of the sun, this soaring tower will stand radiant on the waterfront where the river meets the bay, in the heart of the bright lights of the city. Combining the sparkling vitality and magnetic dynamism of Brickell with enlightened design and artful service, residents can expect a lifestyle infused with unexpected delights and inspired brilliance.
Bentley Residences
Location: Sunny Isles Beach
Developer: Dezer Development
Estimated Completion: 2026
Starting Price Point: $3.6M
Bentley Residences is a 60-story condominium building located in Sunny Isles Beach, Florida. Estimated completion in 2026, Bentley Residences was developed by Dezer Development and designed by Sieger Suarez Architects. Bentley Residences will have 200-plus luxury units. The condos at Bentley Residences will offer unparalleled bay and Miami skyline views.
Residents of Bentley Residences will enjoy a number of state-of-the-art amenities: including a restaurant, cinema, whiskey bar, gym, pool, spa and cigar lounge; cabanas; and landscaped gardens.
St. Regis Residences Brickell
Location: Brickell
Developer: Related Group & Integra Investments
Estimated Completion: 2025
Starting Price Point: $3M
Situated along the beautiful coastline of South Brickell, The St. Regis Residences, Miami epitomize elegant living. It mirrors the sensibilities of those who are driven by connoisseurship, demand excellence, respect tradition and value individuality above all else.
The St. Regis Residences, Miami represents a future propelled by a historic past. A place where new generations will create lifetimes of legendary moments, in one-of-a-kind homes for individuals who perceive their personal legacies innately intertwined with the rich heritage of Miami.
St. Regis Sunny Isles
Location: Sunny Isles Beach
Developer: Fortune International Group and Chateau Group
Estimated Completion: 2026
Starting Price Point: $3.9M
Ideally situated along 435 linear feet of pristine beach and immersed in unforgettable ocean views, The St. Regis Residences, Sunny Isles Beach, Miami, represent the height of exquisite living. Where skyline-defining architecture, visionary style, flawless craftsmanship, and signature St. Regis service and rituals create a singular experience of effortless luxury
in a glamorous setting.
Cipriani Residences
Location: Brickell
Developer: Mast Capital
Estimated Completion: 2025
Starting Price Point: $1.1M
Cipriani Residences Miami is set to be the first-ever, ground-up residential tower developed by the Cipriani brand, known for its elevated hospitality service and sophisticated design. The all-glass skyscraper will soar 80 stories offering sweeping views of Biscayne Bay, the Atlantic Ocean, and the Brickell skyline. Developed by Mast Capital and designed by world-famous architecture firm Arquitectonica, Cipriani Residences Miami will include 397 luxury residences comprised of one-bedroom-plus-den to four-bedroom floor plans plus penthouses (see Cipriani Residences Miami floor plans). Cipriani Residences Miami will include three rooftop penthouses, two of which will have a private swimming pool.
Selling the Metaverse
The metaverse is a 3D, virtual space where we can simulate the real world and/or imagine a new world. Meta-reality can be used to pre-sell new construction, host remote open houses or parties with friends, and build a dream house or entire community to simulate how it functions prior to investing in a real property project.
‘Real estate’ in the metaverse is valuable because it serves as store-fronts for real-world projects and brands and beta tests the potential of new ideas. It can be residential, commercial, advertising, boats, cars, planes or art.
Pricing of metaverse real estate is still based on supply & demand (though scarcity is artificial and code-driven), usage, and location. Thus, land value in the metaverse will be determined by what owners do with a property; like designing a popular attraction, experience, or feature and also by visibility proximate to other attractive parcels.
Celebrities like Snoop Dogg and Paris Hilton have jumped into the metaverse, creating fully immersive experiences for fans. ‘Snoopverse’ will host virtual concerts, art and car exhibits, pool parties, shopping, and a digital replica of his massive California mansion whereas Paris world will offer digital copies of her California home and closet where users can raid her wardrobe and purchase outfits.
So far, metaverse sales have been concentrated to the ‘Big Four’ – Sandbox, Decentraland, Cryptovoxels, and Somnium. In 2021 there were over $500 million in Metaverse sales, with analyst expectations of doubling in 2022.
It is expected that one day we will all have a parallel digital identity living in the metaverse. Typically, the first movers in a space see the best return, and those who are getting involved in the metaverse now cementing their footprint in the space and thus their ROI.
Always an early-mover, Nest Seekers visited the YUPIX meta-reality sales gallery for the E11even Residences in Miami to get a first-hand tour of how the metaverse is helping to sell new construction. This experience combines real property with AR and VR technology to provide a five-sense immersive experience in a real-world environment for potential buyers. Conversion to sales post-meta-reality experience is nearly 100% and the project is 80%+ sold out.
2021 Trends & Indicators Recap
While change was the constant for 2020, the battle of supply and demand was the front-and-center theme for 2021.
The combination of a booming stock market, extremely low interest rates, once-called ‘transitory’ inflation that has become increasingly sticky, and the housing shortage is creating a juxtaposition of opportunity and chaos.
General interest in real estate accelerated, with Nest Seekers Consumer Sentiment data indicating the ever-growing marketplace welcomed over 2,500,000 Absolute Unique Visitors and over 18,000,000 Page Views to nestseekers.com in 2021.
The housing shortage is a continued opportunity for builders, with recent data indicating that we 5.24 million units short of satisfying current demand. Supply chain disruptions, labor shortages, low supply of resale homes, exuberant buying, and rapid household formation by Millenials are all driving factors in this demand, which could be a long-tailed catalyst for the homebuilding industry. Additionally, the number of resale homes hit an all-time low during the week ending on November 28, 2021, with active listings falling 23% from 2020 and 42% from 2019.
With 78% of all US markets hit with double-digit increases, changes in home prices are now outpacing those in income. CNBC reported that over the last decade, the median home price rose roughly 30% and incomes crept up just 11% over the same time period. Over the last 50 years, the difference is even more striking; after accounting for inflation, home prices have jumped 118% since 1965, while income has only increased by 15%, thus indicating that the pandemic accelerated a major divide between home values and income.
For now, it seems prices have leveled off somewhat, but uncertainty remains.
That said, first time home buyers have more skin in the game than ever before with 32% putting more than the standard 20% down and the vast majority of loans being fixed rate.
NS Market Top Notes
NYC
In 2021, we saw NYC come back with a vengeance, with prices souring to pre-COVID levels. Now it seems things are starting to see things level out, and after 13 consecutive months of growth, closed sales in New York have declined in back-to-back months. For the last 11 consecutive months, the number of new lease signings increased year over year, but at a slower pace.
Nest Seekers opened our new Billionaire’s Row flagship store earlier in 2021, thus laying the foundation to capitalize on the city’s bounce back.
Manhattan:
Average Listed Price: Trending up .5% from 2020
Total Active Sales: Trending up 3% from 2020
Average Days on Market: Trending down 19 days from 2020
Total Sales Volume: Trending up 44% from 2020
Total Recorded Sales: Trending up 6,802 sales from 2020
Average PPSF: Trending down 1% from 2020
GREENWICH
The neighborhood trends seem to indicate that while many buyers from New York City have chosen to move to the suburbs, they still value convenience and community. Greenwich is a town of 65,000 +/- people spanning ~60 square miles, and combines New England countryside living with small, but bustling, villages/town centers.
Greenwich:
South of the Parkway Sales Volume: Trending up 184% from 2019
Riverside PPSF: Trending up 23% from 2019
Cos Cob Average Sales Price to Assessment: Trending up 19% from 2019
COLORADO
We also welcomed Colorado-based Day-Palazola Group into the Nest Seekers family this year, and look forward to servicing the ski towns of Breckenridge, Vail, and Aspen. Colorado resort destinations saw total dollar volume sold increase by more than 29% throughout 2021, with Vail alone seeing a 50.5% increase in volume. Mountain luxury is no longer defined as strictly being on the ski hill, there is strong desire for summer activities like golf, mountain biking, fly fishing, sailing and hiking, and local festivals, thus attracting many new full-time residents.
Colorado (Summit County):
New Listings: Trending up 1% from 2020
Average Sales Price: Trending up 26.5% from 2020
Months of Inventory: Trending down 47.3% from 2020
Days on Market: Trending down 55% from 2020
BEVERLY HILLS
The luxury markets in Beverly Hills and Bel Air continue to show strength, with off-market transactions reigning over public MLS listings, and up to 60% of homes selling before they even hit the market. Angelenos simply want what other can’t have. Beverly Hills top producer Dylan Eckardt explains, “I had three clients call me last week asking if I had anything in the $20 million range off-market. I replied back and asked if they had seen what’s on-market… and they said ‘no, but we want something that no one has seen yet.’ It’s unbelievable.”
Beverly Hills:
Average List Price: Trending up 38% from 2020
Total Recorded Sales: Trending up 93% from 2020
Average Days on Market: Trending down 21.1% from 2020
Average Discount to List Price: Trending up 2.3% from 2020
HAMPTONS
It seems that the Hamptons market is running a bit in front of Beverly Hills, but still experiencing much of the same shortage of inventory. JB Andreassi, Nest Seekers agent and star of Selling the Hamptons on Discovery+, says, “It’s been slower out here generally speaking. The combination of holidays, lack of inventory and continued marked-up product has slowed transactions. We are doing everything in our power to get people to list homes. Buyer demand remains strong but no quality inventory is available to meet the demand.”
Hamptons:
Average Price: Trending up 17% from 2020
Total Recorded Sales: Trending down 43.9% from 2020
Average Days on Market: Trending down 65.9% from 2020
Average Discount to List: Trending up 2.9% from 2020
FLORIDA
Miami and Palm Beach continue to be nationwide hot spots, because “everyone still wants to move to Florida… or at least get a foot in the door” says Nest Seekers Palm Beach broker Debbie Ginsburg.
Palm Beach Island
Average Single Family Sale Price: Trending up 72% from 2020
Median Sale Price Condo: Trending up 57% from 2020
Active Single Family Listings on PB Island: Trending down 60% from 2020
Single Family Closings: Trending down 16% from 2020
<1 Month Supply Single Family: Trending down 74% from 2020
Branded new development projects are driving the Miami market and trending towers include Casa Bella by B&B Italia, Baccarat, Bentley, and Missoni Baia. Meanwhile, the greater Palm Beach area has more record-breaking $100 million+ deals in the pipe.
Miami:
Average Sale Price: Trending up 11% from 2020
Total Recorded Sales: Trending up 8% from 2020
Average PPSF: Trending up 13% from 2020
2.2 Months Supply Single Family: Trending down 54% from 2020
LONDON
London, in turn, remains the most expensive of any region in the UK, but it also continues to be the region with the lowest annual growth. Average prices increased by 6.2% over the year to October, up from 2.8% in September. We are starting to see momentum build in the region, however, due to an influx of foreign interest at the top end of the market. Thus it seems that London will now experience much of the same activity volume coming into 2022 that we saw in the US last year.
Prime London:
Average List Price: Trending up 6% from 2020
Average Days on Market: Trending down 15% from 2020
Number of Transactions: Trending up 6.8% from 2020
.6 Months of Inventory: Trending flat from 2020
The Year Ahead
In 2022, as interest rates continue to rise, prices will stabilize, and inventory will begin to reach equilibrium. Cash will continue to be king, unless we are talking cryptocurrency.
The number of transactions without mortgage contingencies hit an all-time high in 2021, as buyers faced stiff competition for prime property. Simultaneously, we saw a substantial number of transactions involving cryptocurrency; including a $22.5 million penthouse at Arte Surfside in Miami trade in crypto in May 2021, and the launch of the first pre-construction condo that accepts crypto, The Waldorf Astoria Residences Miami.
Similarly, we will begin to experience using NFTs in real estate to improve and streamline the closing process and work towards instantaneous settlement by using blockchain to register title, surveys, transfer a property, and complete all background diligence, thus ensuring the transaction’s integrity.
In 2022, amenities will keep getting bigger and better. We have seen the evolution of amenity-rich spaces for years, but smart homes, personal spas, competitive fitness centers, and pet services are now expectations, not wish-list items.
New housing starts will be begin to catch up to demand *if* we are to at least partially quell supply chain issues. Once production and delivery time lines normalize we might even have an over-abundance of materials which will push downward pressure on prices…. Though this is likely years away.
November 2021 Trends & Indicators Report: Where is the smart money buying?
We all know that things are getting more expensive, homes included. Inflation looks like it is here to stay, with October 2021 CPI readings indicating a 6.2% increase, the highest since November of 1990, and well above forecasts of 5.8%.
Consumers have, for the most part, accepted price hikes, and have not pulled back on spending. Fed Chair Jerome Powell has said, “bottleneck effects have been larger and longer-lasting than anticipated… while these supply effects are prominent for now, they will abate. And as they do, inflation is expected to drop back toward our longer-run goal” thus indicating that the Fed was not surprised by the readings, despite having touted ‘transitory’ and ‘short term’ inflation in previous discussions. There is also no exact timeline indicated for a return to normalcy.
Thus, it is becoming even more important to make smart monetary decisions in all aspects of life, real estate included. This month, we want to discuss where the ‘smart money’ is buying in each of the hot markets so as to prevent buyer’s remorse in years to come.
New York City
The outer boroughs are feeling a lot more love these days, and we are seeing a flight to quality and futureproofed investment opportunities in buildings that will stand the test of time. COVID accelerated demand for boutique developments of less than 50 units, often featuring private elevator or ground floor access and parking accessibility. Privacy and suburban amenities with added convenience and commutability is top-of-mind.
Bianca D’Alesso, Nest Seekers Director of New Development, explains: “Long Island City, Williamsburg and Greenpoint offer new buildings filled with amenities. From full service with tremendous views to boutique options near park spaces or along the waterfront with parking in close proximity to Manhattan.”
Long Island City is in the borough of Queens and just 3 miles from Manhattan. The neighborhood features 8 subway lines, including the 7, E, M, R, N, Q, and G, 13 bus lines, and CitiBike stations. It also has the East River Ferry that stops at Hunters Point South and Gantry Plaza State Park. LIC has industrial roots but many of the former factories have been converted to centers of arts and culture, like the Noguchi Museum, MoMA PS1, and SculptureCenter.
Williamsburg has been trending for years now, and has even been called the ‘Avocado Toast’ of NYC by Conde Nast Traveler due to its bevvy of hip coffee shops and creative retail stores along Bedford Avenue. Williamsburg is connected to Greenpoint by McCarren Park, Brooklyn’s equivalent of Central Park, and is passing the torch of neighborhood darling to its’s northern neighbor. Those who feel priced out of Williamsburg can look to Greenpoint, which still offers an intimate community vibe where the local bodega owner knows your coffee order in the morning. The major downside of Greenpoint is reduced public transportation options compared to Williamsburg, but with the shift toward remote work for many, interest in this vibrant, historic neighborhood is now surging.
Palm Beach
Palm Beach has been called the ‘hottest real estate market in the world’ by CNBC, but prices on Palm Beach Island have many saying ‘no way!’ What’s the best way to get a piece of the action and chic lifestyle without the $3,000 psft asking price?
Check out West Palm Beach, particularly the historic El Cid area which is just minutes from trending restaurants like Le Bilboquet and shopping areas like Worth Avenue and The Royal Poinciana Plaza. Also, new and pre-construction condos like Forte and La Clara offer attractive pricing for those who missed the opportunity at The Bristol a couple years ago.
Even ultra-luxury buyers don’t want to overpay, and are thus increasingly focused on Manalapan, which is about 20 minutes south of Palm Beach Island. Manalapan parcels range from one to three acres and offer 300+’ of ocean frontage with added access to the Intracoastal for dockage. In contrast most Palm Beach Island lots are half the size and don’t offer the same access to multiple waterways.
For those looking to a more traditional Florida lifestyle, focused on boating, golf, and outdoor living, Jupiter and neighboring Tequesta may be more of a focus. These neighborhoods have also seen a lot of action over the past year, so smart money is moving even further north, to Vero Beach. In Vero, vacant oceanfront acre parcels are priced between $3-5 million vs. the same land in Palm Beach County ranging anywhere from $15-$30 million (if you can find it).
Miami
We all know South Beach, but where do the Miami locals choose to live? The answer is increasingly Coconut Grove or Downtown.
Coconut Grove is now home to Miami legend Dave Grutman’s Groot Hospitality Group’s new headquarters as well as the much-anticipated Mr. C Residences, however, its history is rich as the oldest continuously inhabited neighborhood of Miami. Located 10 miles south of Downtown, the streets of the Grove are lined with banyan and oak trees, while its shopping areas are boutique and open air, giving a bohemian tropical flair. The Vanguard School and Random Everglades School are considered some of the best in Miami and are both are located within the quiet confines of the Grove. Home prices are higher than many areas of Miami, but awareness and opportunities continue to grow.
Downtown Miami has been overlooked for too long. With close proximity to Brickell and South Beach, it is the central hub the city never really had. The FTX Arena (formerly named American Airlines Arena) shines on Biscayne Bay, with easy access to the People Mover metro that runs from Downtown through Brickell, resembling the closest thing to Manhattan outside of the city. The new 1000’ Waldorf Astoria Residences tower is going to change the Miami skyline forever, and has seen tremendous pre-constructions sales well-ahead of its 2025 expected delivery date. The Mayor of Miami, Francis Suarez, has taken a particular liking to Downtown as we see more and more financial institutions and cryptocurrency leaders move into the area.
Link Waldorf video https://youtu.be/gC_wZ8nAoMI
Not to mention, the State of Florida expects 906 new residents per day through April 2024, representing an annual compound growth rate of 1.53%, with Miami representing a significant stake in this trend. The GDP of Florida is more than $1.1 trillion and has grown by nearly 52% over the past ten years, and Miami is proactively recruiting high net worth individuals and startup talent away from Silicon Valley, thus accelerating job growth and ranking the state as the fifth-best for doing business, according to Forbes.
Greenwich
The Backcountry Greenwich neighborhood had been fading in popularity and price in prior years, but was given new life during the pandemic. The continuation of WFH or hybrid WFH business models seem to be the driving force behind renewed interest, especially when combined with Governor Lamont’s ability to entice corporations to relocate their businesses to Connecticut. Sparce supply has continued despite high demand.
The neighborhood trends seem to indicate that while many buyers from New York City have chosen to move to the suburbs, they still value convenience and community. Greenwich is a town of 65,000 +/- people spanning ~60 square miles, and combines New England countryside living with small, but bustling, villages/town centers. Cos Cob known for its “urban chic” vibes, walkability, convenient shops, parks and train stations make it perfect for commuters balancing city and suburban life.
The best return on investment is often found in secondary or sub-markets; those experiencing above-average population and economic growth. They offer most of the amenities that you would find in spotlight markets without the dense population and/or stiff competition. Secondary markets are less volatile in times of recession and thus are attractive to long-term investors. Thus, instead of positioning these neighborhoods as below their ‘famous’ and oft-storied counterparts, think of them as smart-money opportunities for a higher ROI.